Navigating the Linux kernel network stack: receive path:
Linux networking from ground up
Background
At work we practice continuous integration in terms of performance testing alongside different stages of functional testing.
In order to do this, we have a performance environment that fully replicates the hardware and software used in our production environments. This is necessary in order to be able to find the limits of our system in terms of throughput and latency, and means that we make sure that the environments are identical, right down to the network cables.
Since we like to be ahead of the curve, we are constantly trying to push the boundaries of our system to find out where it will fall over, and the nature of the failure mode.
This involves running production-like load against the system at a much higher rate than we have ever seen in production. We currently aim to be able to handle a constant throughput of 2-5 times the maximum peak throughput ever observed in production. We believe that this will give us enough headroom to handle future capacity requirements.
Our Performance & Capacity team has a constant background task of:
- increase load applied to the system until it breaks
- find and fix the bottleneck
There is actually a third step to this process, which is something like 'buy new hardware' or 'modify the system to do less work', since there is only so much than tuning will buy you.
The code that is inspected in this article is that taken by inbound multicast traffic on Linux kernel version 4.0.
Identifying a bottleneck
During the latest iteration of the break/fix cycle, we identified one particular service as problematic. The service in question is one of those responsible for consuming the output of our matching engine, which can peak at 250,000 messages per second at our current performance-test load.
When we have a bottleneck in one of our services, it usually follows a familiar pattern of back-pressure from the application processing thread, resulting in packets being dropped by the networking card.
In this case however, we could see from our monitoring that we were not suffering from any processing back-pressure, so it was necessary to delve a little deeper into the network packet receive path in order to understand the problem.
Understanding the data flow
Components involved in network packet receipt
Before looking at the available statistics, let's take a look at how a packet is handled once it is pulled off the wire.
The journey begins in the network driver code; this is vendor-specific and in the majority of cases open source. In this example, we're working with an Intel 10Gb card, which uses the ixgbe driver. You can find out the driver used by a network interface by using
ethtool:
ethtool -i <device-name>This will generate output that looks something like:
driver: ixgbe
version: 3.19.1-k
firmware-version: 0x546d0001
bus-info: 0000:41:00.0
supports-statistics: yes
supports-test: yes
supports-eeprom-access: yes
supports-register-dump: yes
supports-priv-flags: no
The driver code can be found in the Linux kernel source here.
NAPI
NAPI, or New API is a mechanism introduced into the kernel several years ago. More background can be read here, but in summary, NAPI increases network receive performance by changing packet receipt from interrupt-driven to polling-mode.
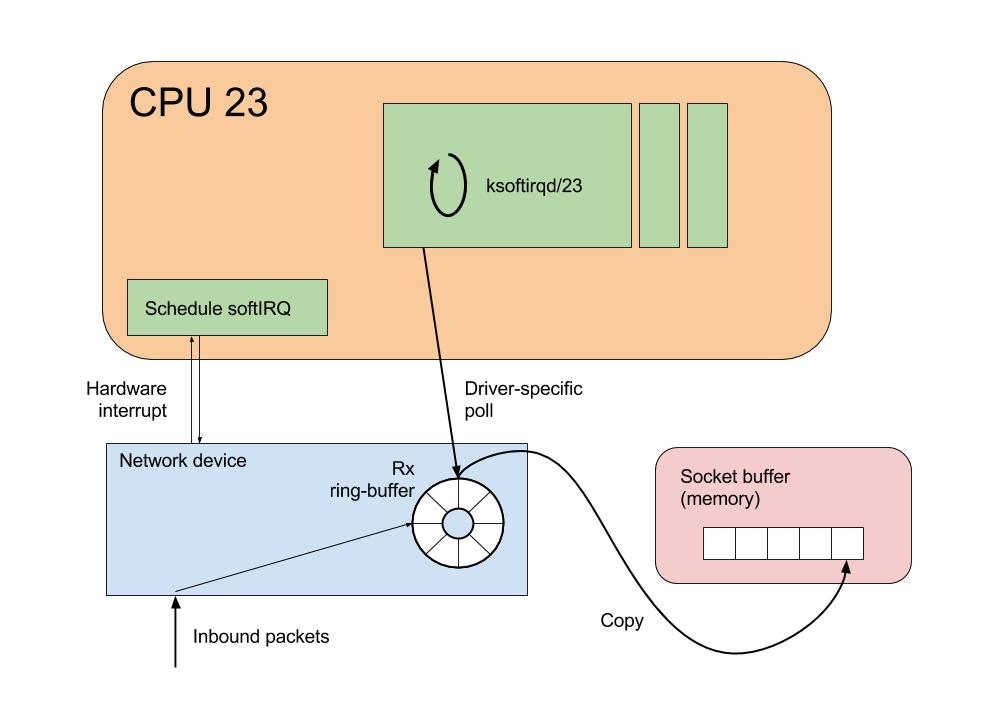
Previous to the introduction of NAPI, network cards would typically fire a hardware interrupt for each received packet. Since an interrupt on a CPU will always cause suspension of the executing software, a high interrupt rate can interfere with software performance. NAPI addresses this by exposing a poll method to the kernel, which is periodically executed (actually via an interrupt). While the poll method is executing, receive interrupts for the network device are disabled. The effect of this is that the kernel can drain potentially multiple packets from the network device receive buffer, thus increasing throughput at the same time as reducing the interrupt overhead.
Interrupt handling
When the network device driver is initially configured, it first associates a handler function with the receive interrupt. This function will be invoked whenever the CPU receives a hardware interrupt from the network card.
For the card that we're looking at, this happens in a method called ixgbe_request_msix_irqs:
request_irq(entry->vector, &ixgbe_msix_clean_rings, 0,
   q_vector->name, q_vector);
So when an interrupt is received by the CPU, the ixgbe_msix_clean_rings method simply schedules a NAPI poll, and returns IRQ_HANDLED:
static irqreturn_t ixgbe_msix_clean_rings(int irq, void *data)
{
    struct ixgbe_q_vector *q_vector = data;
    ...
    if (q_vector->rx.ring || q_vector->tx.ring)
        napi_schedule(&q_vector->napi);

    return IRQ_HANDLED;
}
Scheduling the NAPI poll entails adding some work to the per-cpu poll list maintained in the
softnet_data structure:
static inline void ____napi_schedule(struct softnet_data *sd,
                                     struct napi_struct *napi)
{
    list_add_tail(&napi->poll_list, &sd->poll_list);
    __raise_softirq_irqoff(NET_RX_SOFTIRQ);
}
and then raising a
softirq event. Once the softirq event has been raised, the driver knows that the poll function will be called in the near future.softirq processing
For more background on interrupt handling, the Linux Device Drivers book has a chapter dedicated to this topic. Suffice to say, doing work inside of a hardware interrupt context is generally avoided within the kernel; while handling a hardware interrupt a CPU is not executing user or kernel software threads, and no other hardware interrupts can be handled until the current routine is complete. One mechanism for dealing with this is to use
softirqs.Each CPU in the system has a bound process called
ksoftirqd/<cpu_number>, which is responsible for processing softirqevents.In this manner, when a hardware interrupt is received, the driver raises a softIRQ to be processed on the
ksoftirqd process. So it is this process that will be responsible for calling the driver's poll method.The
softirq handler net_rx_action is configured for network packet receive events during device initialisation. All softirqevents of type NET_RX_SOFTIRQ will be handled by the net_rx_action function.So, having followed the code this far, we can say that when a network packet is in the device's receive ring-buffer, the
net_rx_action function will be the top-level entry point for packet processing.net_rx_action
At this point, it is instructive to look at a function trace of the
ksoftirqd process. This trace was generated using ftrace, and gives a high-level overview of the functions involved in processing the available packets on the network device.
net_rx_action() {
  ixgbe_poll() {
    ixgbe_clean_tx_irq();
    ixgbe_clean_rx_irq() {
      ixgbe_fetch_rx_buffer() {
        ... // allocate buffer for packet
      } // returns the buffer containing packet data
      ... // housekeeping
      napi_gro_receive() {
        // generic receive offload
        dev_gro_receive() {
          inet_gro_receive() {
            udp4_gro_receive() {
              udp_gro_receive();
            }
          }
        }
        netif_receive_skb_internal() {
          __netif_receive_skb() {
            __netif_receive_skb_core() {
              ...
              ip_rcv() {
                ...
                ip_rcv_finish() {
                  ...
                  ip_local_deliver() {
                    ip_local_deliver_finish() {
                      raw_local_deliver();
                      udp_rcv() {
                        __udp4_lib_rcv() {
                          __udp4_lib_mcast_deliver() {
                            ...
                            // clone skb & deliver
                            flush_stack() {
                              udp_queue_rcv_skb() {
                                ... // data preparation
                                // deliver UDP packet
                                // check if buffer is full
                                __udp_queue_rcv_skb() {
                                  // deliver to socket queue
                                  // check for delivery error
                                  sock_queue_rcv_skb() {
                                    ...
                                    _raw_spin_lock_irqsave();
                                    // enqueue packet to socket buffer list
                                    _raw_spin_unlock_irqrestore();
                                    // wake up listeners
                                    sock_def_readable() {
                                      __wake_up_sync_key() {
                                        _raw_spin_lock_irqsave();
                                        __wake_up_common() {
                                          ep_poll_callback() {
                                            ...
                                            _raw_spin_unlock_irqrestore();
                                          }
                                        }
                                        _raw_spin_unlock_irqrestore();
                                      }
...
The
softirq handler performs the following steps:- Call the driver's poll method (in this case
ixgbe_poll) - Perform some GRO functions to group packets together into a larger work unit
- Call the packet type's handler function (
ip_rcv) to walk down the protocol chain - Parse IP headers, perform checksumming then call
ip_rcv_finish - The buffer's destination function is invoked, in this case
udp_rcv - Since these are multicast packets,
__udp4_lib_mcast_deliveris called - The packet is copied and delivered to each registered UDP socket queue
- In
udp_queue_rcv_skb, buffers are checked and if space remains, the skb is added to the end of the socket's queue
Monitoring back-pressure
When attempting to increase the throughput of an application, we need to understand where back-pressure is coming from.
At this point in the data receive path, we could have throughput issues for two reasons:
- The
softirqhandling mechanism cannot dequeue packets from the network device fast enough - The application processing the destination socket is not dequeuing packets from the socket buffer fast enough
softirq back-pressure
For the first case, we need to look at softnet stats (
/proc/net/softnet_stat), which are maintained by the network receive stack.The softnet stats are defined here as the per-cpu struct
softnet_data, which contains a few fields of interest: processed, time_squeeze and dropped.
processed is the total number of packets processed, so is a good indicator of total throughput.
time_squeeze is updated if the ksoftirq process cannot process all packets available in the network device ring-buffer before its cpu-time is up. The process is limited to 2 jiffies of processing time, or a certain amount of 'work'.There are a couple of sysctls that control these parameters:
net.core.netdev_budget- the total amount of processing to be done in one invocation of net_rx_actionnet.core.dev_weight- an indicator to the network driver of how much work to do per invocation of its napi poll method
ksoftirq daemon will continue to call napi_poll until either the time has run out, or the amount of work reported as completed by the driver exceeds the value of net.core.netdev_budget.This behaviour will be driver-specific; in the Intel 10Gb driver, completed work will always be reported as
net.core.dev_weight if there are still packets to be processed at the end of a poll invocation.Given some example numbers, we can determine how many times the napi_poll function will be called for a
softIRQ event:
net.core.netdev_budget = 300
net.core.dev_weight = 64

poll_count = (300 / 64) + 1 => 5
If there are still packets to be processed in the network device ring-buffer, then the
time_squeeze counter will be incremented for the given CPU.The
dropped counter is only used when the ksoftirq process is attemping to add a packet to the backlog queue of another CPU. This can happen if Receive Packet Steering is enabled, but since we are only looking at UDP multicast without RPS, I won't go into the detail.So if our kernel helper thread is unable to move packets from the network device receive queue to the socket's receive buffer fast enough, we can expect the
time_squeeze column in /proc/net/softnet_stat to increase over time.In order to interpret the file, it is worth looking at the implementation. Each row represents a CPU-local instance of the
softnet_stat struct (starting with CPU0 at the top), and the third column is the time_squeeze entry.The only tunable that we have at our disposal is the
netdev_budget value. Increasing this will allow the ksoftirq process to do more work. The process will still be limited by a total processing time of 2 jiffies though, so there will be an upper ceiling to packet throughput.Given the speeds that modern processors are capable of, it is unlikely that the
ksoftirq daemon will be unable to keep up with the flow of data, if properly configured.In order to give the kernel the best chance to do so, make sure that there is no contention for CPU resources by assigning network interrupts to a number of cores, and then using isolcpus to make sure that no other processes will be running on them. This will give the
ksoftirq daemon the best chance of copying the inbound packets in a timely manner.If the
ksoftirq daemon is squeezed frequently enough, or is just unable to get CPU time, then the network device will be forced to drop packets from the wire. In this case, we can use ethtool to find the rx_missed_errors count:
ethtool -S <device-name> | grep rx_missed
rx_missed_errors: 0
alternatively, the same data can be found by looking at the following file:
/sys/class/net/<device-name>/statistics/rx_missed_errorsFor a full description of each of the statistics reported by
ethtool, refer to this document.Application back-pressure
It is far more likely that our user programs will be the bottleneck here, and in order to determine whether that is the case, we need to look at the next stage in the message receipt path. A continuation of this post will explore that area in more detail.
Summary
For UDP-multicast traffic, we have seen in detail the code paths involved in moving an inbound network packet from a network device to a socket's input buffer. This stage can be broadly summarised as follows:
- On packet receipt, the network device fires a hardware interrupt to the configured CPU
- The hardware interrupt handler schedules a
softIRQon the same CPU - The
softIRQhandler thread (ksoftirqd) will disable receive interrupts and poll the card for received data - Data will be copied from the network device's receive buffer into the destination socket's input buffer
- After a certain amount of work has been done, or no inbound packets remain, the
ksoftirqdaemon will re-enable receive interrupts and return
- Increase the amount of work that the
ksoftirqdaemon is allowed to do (net.core.netdev_budget) - Make sure that the
ksoftirqdaemon is not contending for CPU resource or being descheduled due to other hardware interrupts - Increase the size of the network device's ring-buffer (
ethtool -g <device-name>)
First, make sure that you know what the problem is (i.e.
rx_missed_errors or time_squeeze is increasing), the add the relevant monitoring. For this particular case, we would want to be able to correlate the application experiencing message loss with a change in the relevant counters, so recording and charting the numbers would be a good start.Once this has been done, changes can be made to system configuration to see if an improvement can be made.
Lastly, any changes to the tuning parameters that I've mentioned MUST be configured via automation. We have sadly lost a fair amount of time to manual changes being made on machines that have not persisted across reboots.
It is all too easy (and I speak as a repeat offender) to make adjustments, find the optimal configuration, and then move on to something else. Do yourself and your colleagues a favour and automate configuration management!
Resources
I read lots of really useful documents while learning about this area of the kernel. Here are a few of them:
https://www.coverfire.com/articles/queueing-in-the-linux-network-stack/
https://access.redhat.com/sites/default/files/attachments/20150325_network_performance_tuning.pdf
https://www.kernel.org/doc/Documentation/networking/scaling.txt
https://wiki.openwrt.org/doc/networking/praxis
Navigating the Linux kernel network stack: into user land
This is a continuation of my previous post, in which we follow the path of an inbound multicast packet to the user application.
At the end of the last post, I mentioned that application back-pressure was most likely to be the cause of receiver packet-loss. As we continue through the code path taken by inbound packets up into user-land, we will see the various points at which data will be discarded due to slow application processing, and what metrics can shed light on these events.
First of all, let's take a quick look at how a received data packet is matched up to its handler function.
We can see from the stack-trace below that the top-level function calls when dealing with the packets are
The protocol-to-handler mapping can be viewed in the file
Comparing against this reference, it is clear that the kernel reads the value of the ethernet frame's
So our inbound packet will be processed by the capture hooks, even if no packet capture is running (this then must presumably be very cheap), before being passed to the correct protocol handler, in this case
As discussed previously, each socket on the system has a receive-side FIFO queue that is written to by the kernel, and read from by the user application.
Before calling the
Assuming that the packet is not dropped by a filter,
In the internals of the
Simple validation performed at this point includes packet-length check and checksum. Failure of these checks will cause the relevant statistics to be updated in the global udp statistics table.
Because the traffic we're tracing is multicast, the next handler function is
With some exotic locking in place, the kernel determines how many different sockets this multicast packet needs to be delivered to. It is worth noting here that there is a smallish number (
An effort is made to enumerate the registered sockets with a lock held, then perform the packet dispatching without a lock. However, if the number of registered sockets exceeds the specified threshold, then packet dispatch (the
Once in
If the kernel is unable to allocate memory in order to copy the buffer, the socket's drop-count will be incremented, along with the
After another checksum test, we are finally at the point where socket-buffer overflow is tested:
If the size of the socket's backlog queue, plus the memory used in the receive queue is greater than the socket receive buffer size, then the
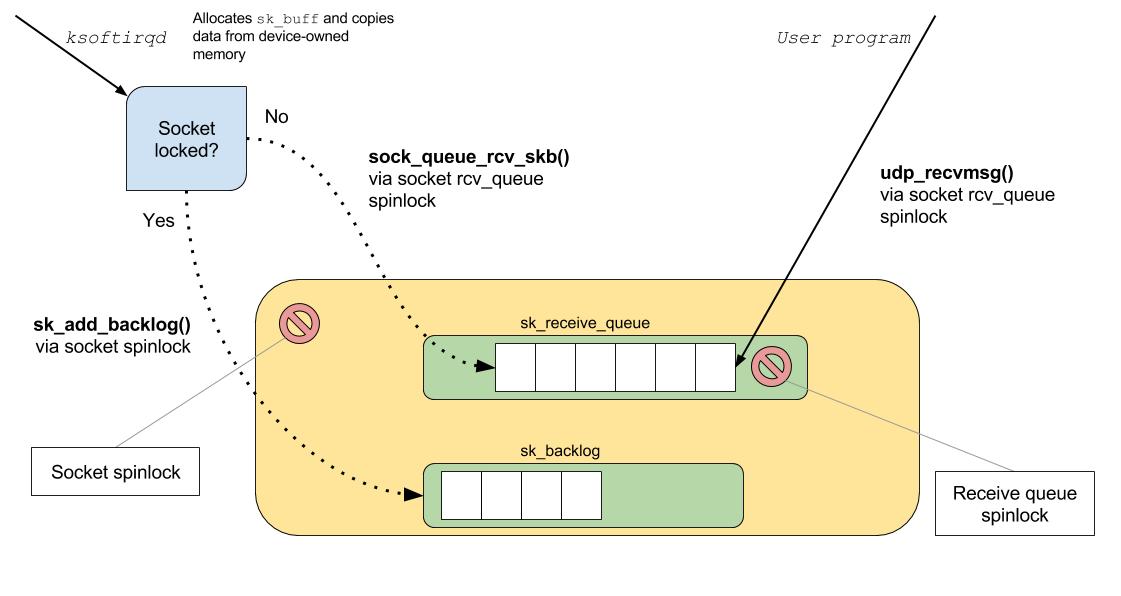
To safely handle multi-threaded access to the socket buffer, if an application has locked the socket, then the inbound packet will be queued to the socket's backlog queue. The backlog queue will be processed when the lock owner releases the lock.
Otherwise, pending more checks that socket memory limits have not been exceeded, the packet is added to the socket's
Finally, once the packet has been delivered to the socket's receive queue, notification is sent to any interested listeners.
Now that we have seen where the various capacity checks are made, we can make some observations in the
There are protocol-specific files in
This file contains statistics on multiple protocols, and is the target for updates to the UDP receive buffer errors. So when we want to know about system-wide receive errors, this is the place to look. When this file is read, a function call iterates through the stored values and writes them to the supplied destination. Such is the magic of
In the output below, we can see that there have been several receive errors (
Each of the columns maps to a constant specified here, so to determine when these values are updated, we simply need to search for the constant name.
There is a subtle difference between
This file contains socket-specific statistics, which only live for the lifetime of a socket. As we have seen from the code so far, each time the
So if we need to differentiate between drop events on a per-socket basis, this file is what we need to observe. The contents below can be explained by looking at the handler function for socket data:
For observing back-pressure, we are interested in the drops column, and the rx_queue column, which is a snapshot of the amount of queued data at the time of reading. Local and remote addresses are hex-encoded
Monitoring this file can tell us if our application is falling behind the packet arrival rate (increase in
If we wish to capture more data about packets that are being dropped, there a three tracepoints that are of interest.
These events can be captured using Linux kernel tracing tools such as
Let's just recap the points of interest for monitoring throughput issues in the network receive path.
At the end of the last post, I mentioned that application back-pressure was most likely to be the cause of receiver packet-loss. As we continue through the code path taken by inbound packets up into user-land, we will see the various points at which data will be discarded due to slow application processing, and what metrics can shed light on these events.
Protocol mapping
First of all, let's take a quick look at how a received data packet is matched up to its handler function.
We can see from the stack-trace below that the top-level function calls when dealing with the packets are
packet_rcv and ip_rcv:__netif_receive_skb_core() {
packet_rcv() {
skb_push();
__bpf_prog_run();
consume_skb();
}
bond_handle_frame() {
bond_3ad_lacpdu_recv();
}
packet_rcv() {
skb_push();
__bpf_prog_run();
consume_skb();
}
packet_rcv() {
skb_push();
__bpf_prog_run();
consume_skb();
}
ip_rcv() {
...
__bpf_prog_run function call, which indicates that this is the entry point for pcap packet capture and filtering.The protocol-to-handler mapping can be viewed in the file
/proc/net/ptype:
[pricem@metal]$ cat /proc/net/ptype
Type Device      Function
ALL  em1      packet_rcv
0800          ip_rcv
0011          llc_rcv [llc]
0004          llc_rcv [llc]
88f5          mrp_rcv [mrp]
0806          arp_rcv
86dd          ipv6_rcv
Comparing against this reference, it is clear that the kernel reads the value of the ethernet frame's
EtherType field and dispatches to the corresponding function. There are also some functions that will be executed for all packet types (signified by type ALL).So our inbound packet will be processed by the capture hooks, even if no packet capture is running (this then must presumably be very cheap), before being passed to the correct protocol handler, in this case
ip_rcv.The socket buffer
ip_rcv starts by getting its own copy of the incoming packet, copying if the packet is already shared. If the copy fails due to lack of memory, then the packet is discarded, and the Discard count of the global ip statistics table is incremented. Other checks made at this point include the IP checksum, header-length check and truncation check, each of which update the relevant metrics.Before calling the
ip_rcv_finish function, the packet is diverted through the netfilter module where software-based network filtering can be applied.Assuming that the packet is not dropped by a filter,
ip_rcv_finish passes the packet on to the next protocol-handler in the chain, in this instance, udp_rcv.In the internals of the
udp_rcv function, we finally get to the point of accessing the socket FIFO queue.Simple validation performed at this point includes packet-length check and checksum. Failure of these checks will cause the relevant statistics to be updated in the global udp statistics table.
Because the traffic we're tracing is multicast, the next handler function is
__udp4_lib_mcast_deliver.With some exotic locking in place, the kernel determines how many different sockets this multicast packet needs to be delivered to. It is worth noting here that there is a smallish number (
256 / sizeof( struct sock)) of sockets that can be listening to a given multicast address before the possibility of greater lock-contention creeps in.An effort is made to enumerate the registered sockets with a lock held, then perform the packet dispatching without a lock. However, if the number of registered sockets exceeds the specified threshold, then packet dispatch (the
flush_stack function) will be handled while a lock is held.Once in
flush_stack, the packet is copied for each registered socket, and pushed onto the FIFO queue.If the kernel is unable to allocate memory in order to copy the buffer, the socket's drop-count will be incremented, along with the
RcvBufErrors and InErrors metrics in the global udp statistics table.After another checksum test, we are finally at the point where socket-buffer overflow is tested:
if (sk_rcvqueues_full(sk, sk->sk_rcvbuf)) {
    UDP_INC_STATS_BH(sock_net(sk), UDP_MIB_RCVBUFERRORS,
                     is_udplite);
    goto drop;
}
If the size of the socket's backlog queue, plus the memory used in the receive queue is greater than the socket receive buffer size, then the
RcvBufferErrors and InErrors metrics are updated in the global udp statitics table, along with the socket's drop count.To safely handle multi-threaded access to the socket buffer, if an application has locked the socket, then the inbound packet will be queued to the socket's backlog queue. The backlog queue will be processed when the lock owner releases the lock.
Otherwise, pending more checks that socket memory limits have not been exceeded, the packet is added to the socket's
sk_receive_queue.Finally, once the packet has been delivered to the socket's receive queue, notification is sent to any interested listeners.
Kernel statistics
Now that we have seen where the various capacity checks are made, we can make some observations in the
proc file system.There are protocol-specific files in
/proc/net that are updated by the kernel whenever data is received.
/proc/net/snmp
This file contains statistics on multiple protocols, and is the target for updates to the UDP receive buffer errors. So when we want to know about system-wide receive errors, this is the place to look. When this file is read, a function call iterates through the stored values and writes them to the supplied destination. Such is the magic of
procfs.In the output below, we can see that there have been several receive errors (
RcvbufErrors), and the number is matched by the InErrors metric:Udp: InDatagrams NoPorts InErrors OutDatagrams RcvbufErrors SndbufErrors InCsumErrors
Udp: 281604018683 4 261929024 42204463516 261929024 0 0Each of the columns maps to a constant specified here, so to determine when these values are updated, we simply need to search for the constant name.
There is a subtle difference between
InErrors and RcvbufErrors, but in our case when looking for socket buffer overflow, we only care about RcvbufErrors.
/proc/net/udp
This file contains socket-specific statistics, which only live for the lifetime of a socket. As we have seen from the code so far, each time the
RcvbufErrors metric has been incremented, so too has the corresponding sk_drops value for the target socket.So if we need to differentiate between drop events on a per-socket basis, this file is what we need to observe. The contents below can be explained by looking at the handler function for socket data:
[pricem@metal ~]# cat /proc/net/udp
sl  local_address rem_address   st tx_queue rx_queue ... inode ref pointer drops
47: 00000000:B87A 00000000:0000 07 00000000:00000000 ...  239982339 2 ffff88052885c440 0
95: 4104C1EF:38AA 00000000:0000 07 00000000:00000000 ...  239994712 2 ffff8808507ed800 0
95: BC04C1EF:38AA 00000000:0000 07 00000000:00000000 ...  175113818 2 ffff881054a8b080 0
95: BE04C1EF:38AA 00000000:0000 07 00000000:00000000 ...  175113817 2 ffff881054a8b440 0
...
For observing back-pressure, we are interested in the drops column, and the rx_queue column, which is a snapshot of the amount of queued data at the time of reading. Local and remote addresses are hex-encoded
ip:port addresses.Monitoring this file can tell us if our application is falling behind the packet arrival rate (increase in
rx_queue), or whether the kernel was unable to copy a packet into the socket buffer due to it already being full (increase in drops).Tracepoints
If we wish to capture more data about packets that are being dropped, there a three tracepoints that are of interest.
sock:sock_rcvqueue_full: called when the amount of memory already allocated to the socket buffer is greater than or equal to the configured socket buffer size.sock:sock_exceed_buf_limit: called when the kernel is unable to allocate more memory for the socket buffer.udp:udp_fail_queue_rcv_skb: called shortly after thesock_rcvqueue_fullevent trace for the same reason.
These events can be captured using Linux kernel tracing tools such as
perf or ftrace.Summary
Let's just recap the points of interest for monitoring throughput issues in the network receive path.
/proc/net/softnet_stat: contains statistics updated by the ksoftirq daemon. Useful metrics are processed, timesqueeze and dropped (discussed in detail in the last post)./proc/net/snmp: contains system-wide statistics for IP, TCP, UDP. Useful metrics indicate memory exhaustion, buffer exhaustion, etc./proc/net/udp: contains per-socket information. Useful for monitoring queue depths/drops for a particular socket./proc/net/dev: contains statistics provided by network devices present on the system. Some supplied statistics are driver-specific./sys/class/net/DEV_NAME/statistics: provides more detailed statistics from the network device driver.
No comments:
Post a Comment